
Application performance monitoring
Connect application behaviour and transaction performance to service priorities, guiding investigation around the user experience that matters to your business.
See the service. Understand the issue.
Bring application, network and infrastructure signals into clear dashboards that help teams diagnose issues and improve service performance.
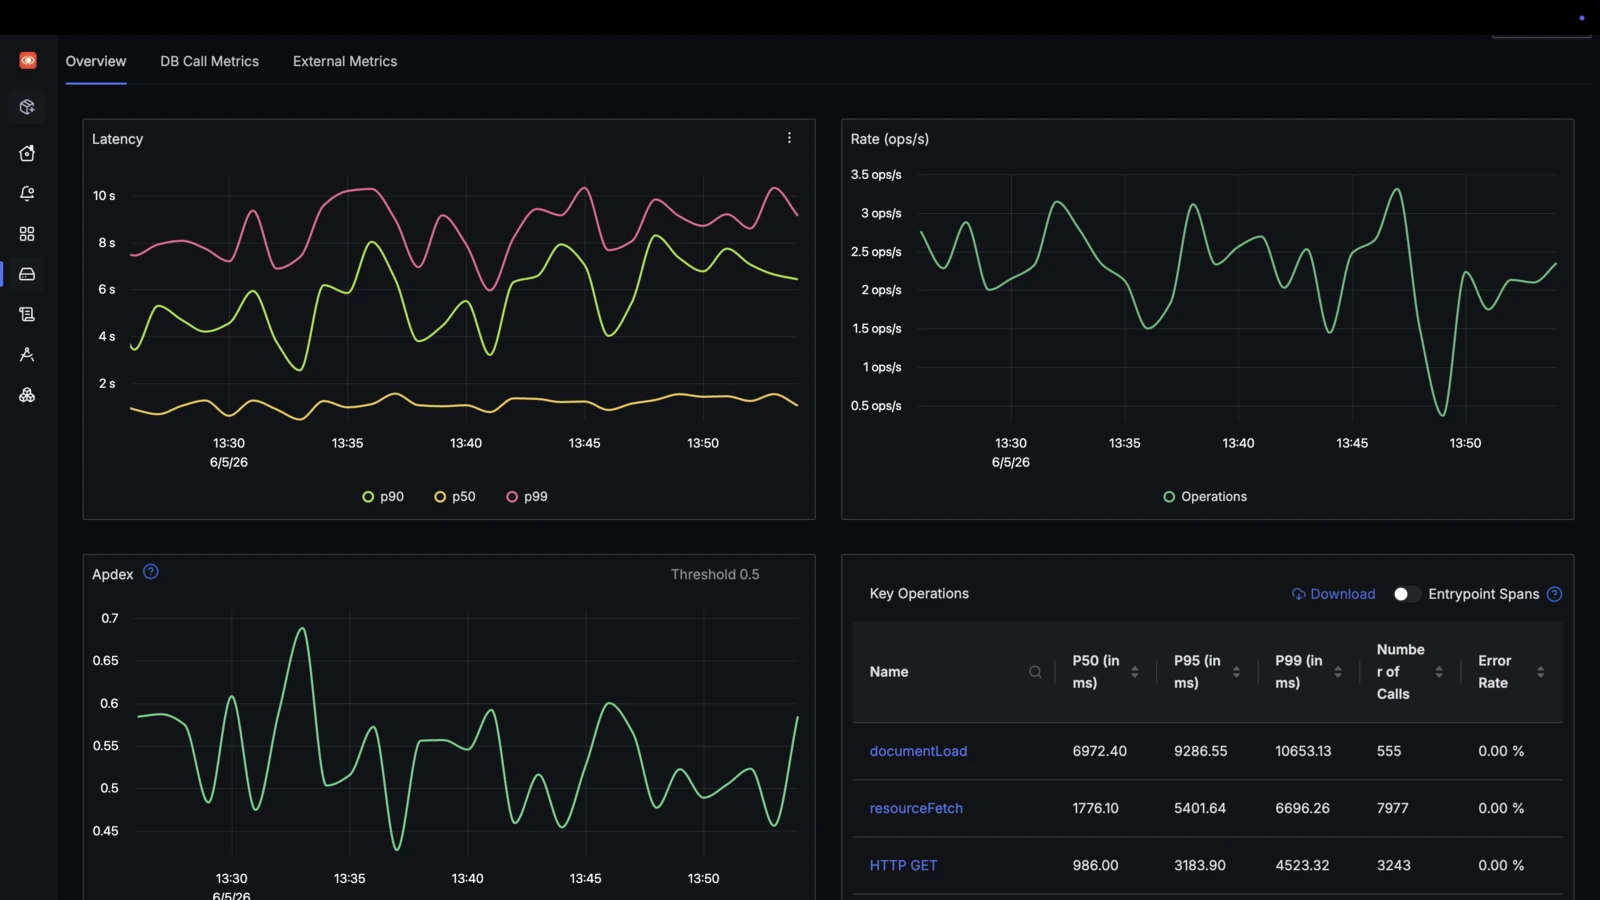
Application-performance monitoring in SigNoz. Product demonstration screen.
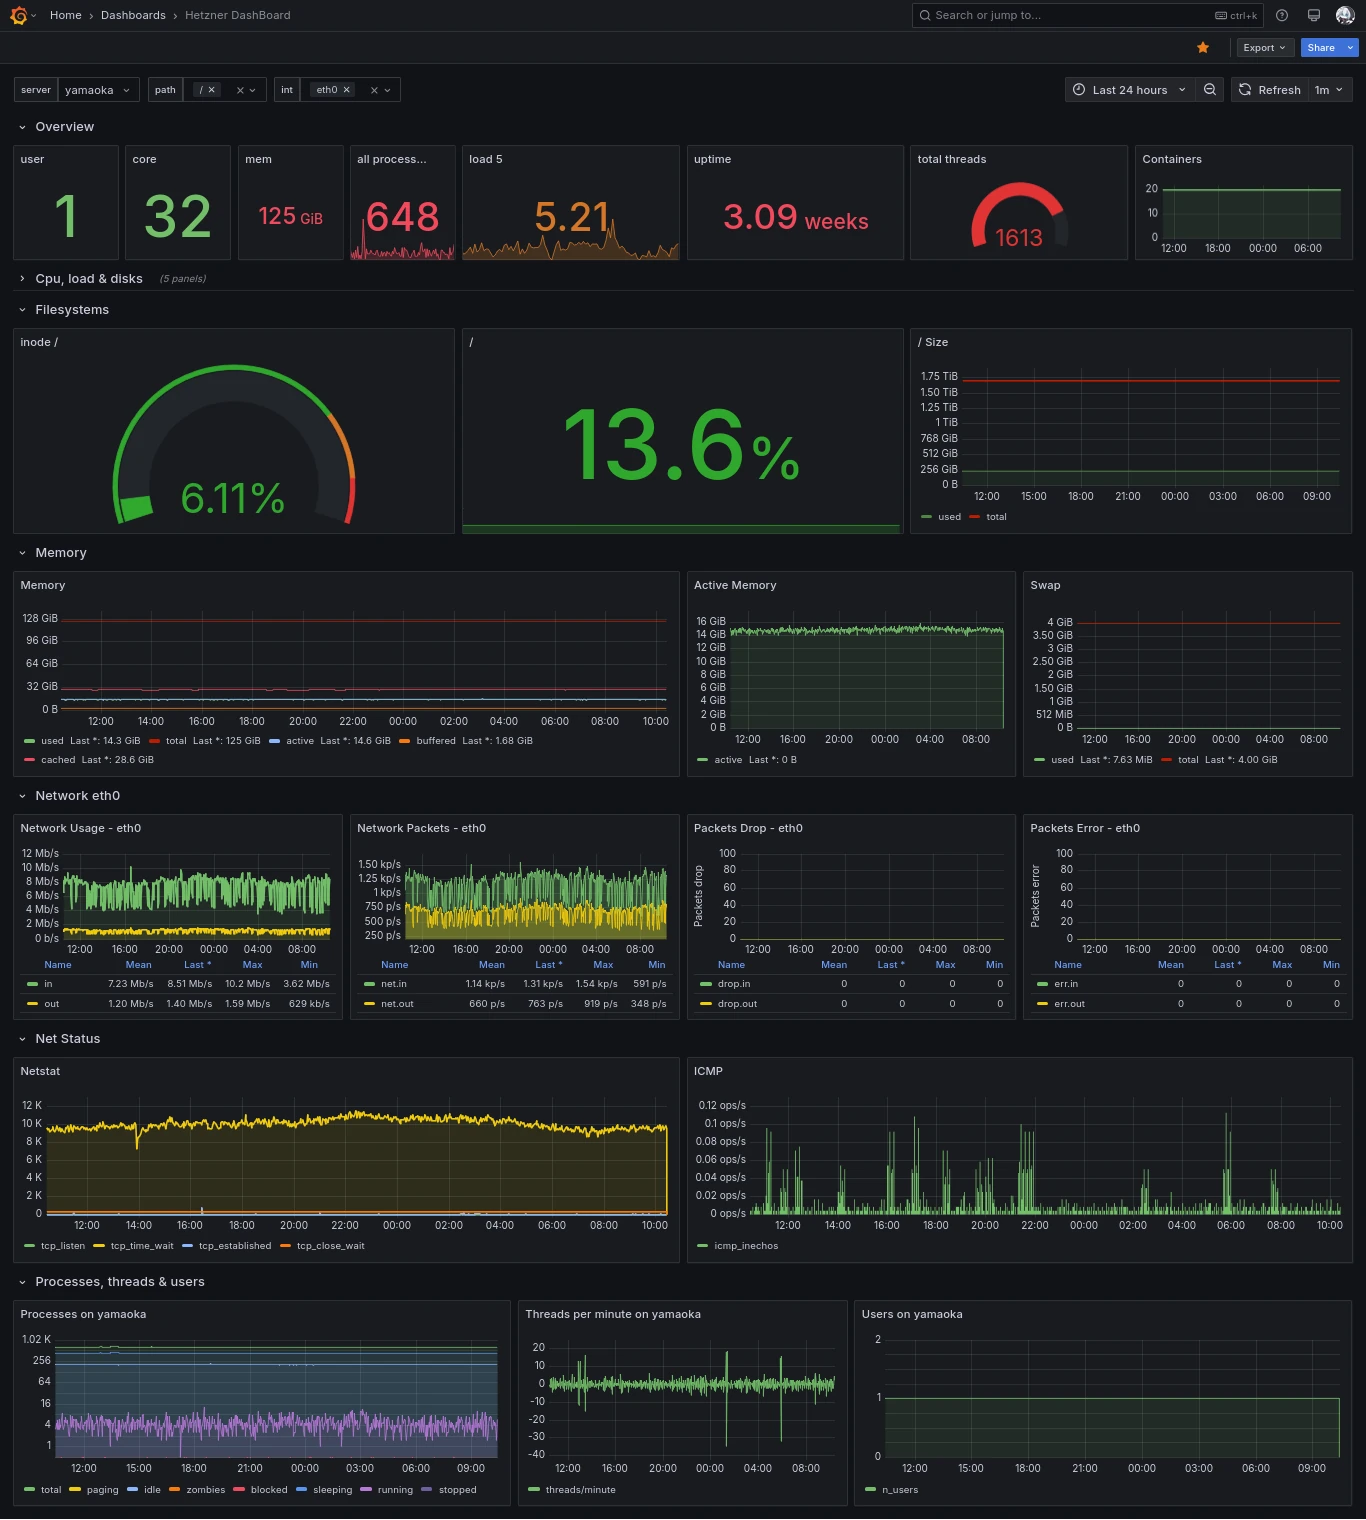
System-observability dashboard in Grafana. Public MetaBrainz monitoring screen.
Connect application behaviour and transaction performance to service priorities, guiding investigation around the user experience that matters to your business.
Bring network and service signals together to support dependency analysis, capacity planning and the diagnosis of performance problems.
Monitor infrastructure health and availability around business workloads, using meaningful thresholds and clear ownership of the resulting alerts.
Use events and logs to explain incidents, recurring patterns and the conditions surrounding changes in service performance.
Design dashboards, reporting and alert thresholds around operational decisions, with escalation routes that turn signals into useful action.
Investigate degradation and bottlenecks, then prioritise improvements with the teams responsible for applications, networks and supporting infrastructure.
Identify critical services, dependencies, pain points and the teams that respond.
Define monitoring coverage, useful thresholds, dashboards and escalation.
Connect agreed platforms and data sources; reduce noise and validate alert behaviour.
Review incidents and trends to inform capacity, performance and reliability decisions.
Platform selection follows your requirements and existing environment.





Tell us which services matter most and where visibility is missing. We’ll discuss monitoring, diagnosis, and response priorities.